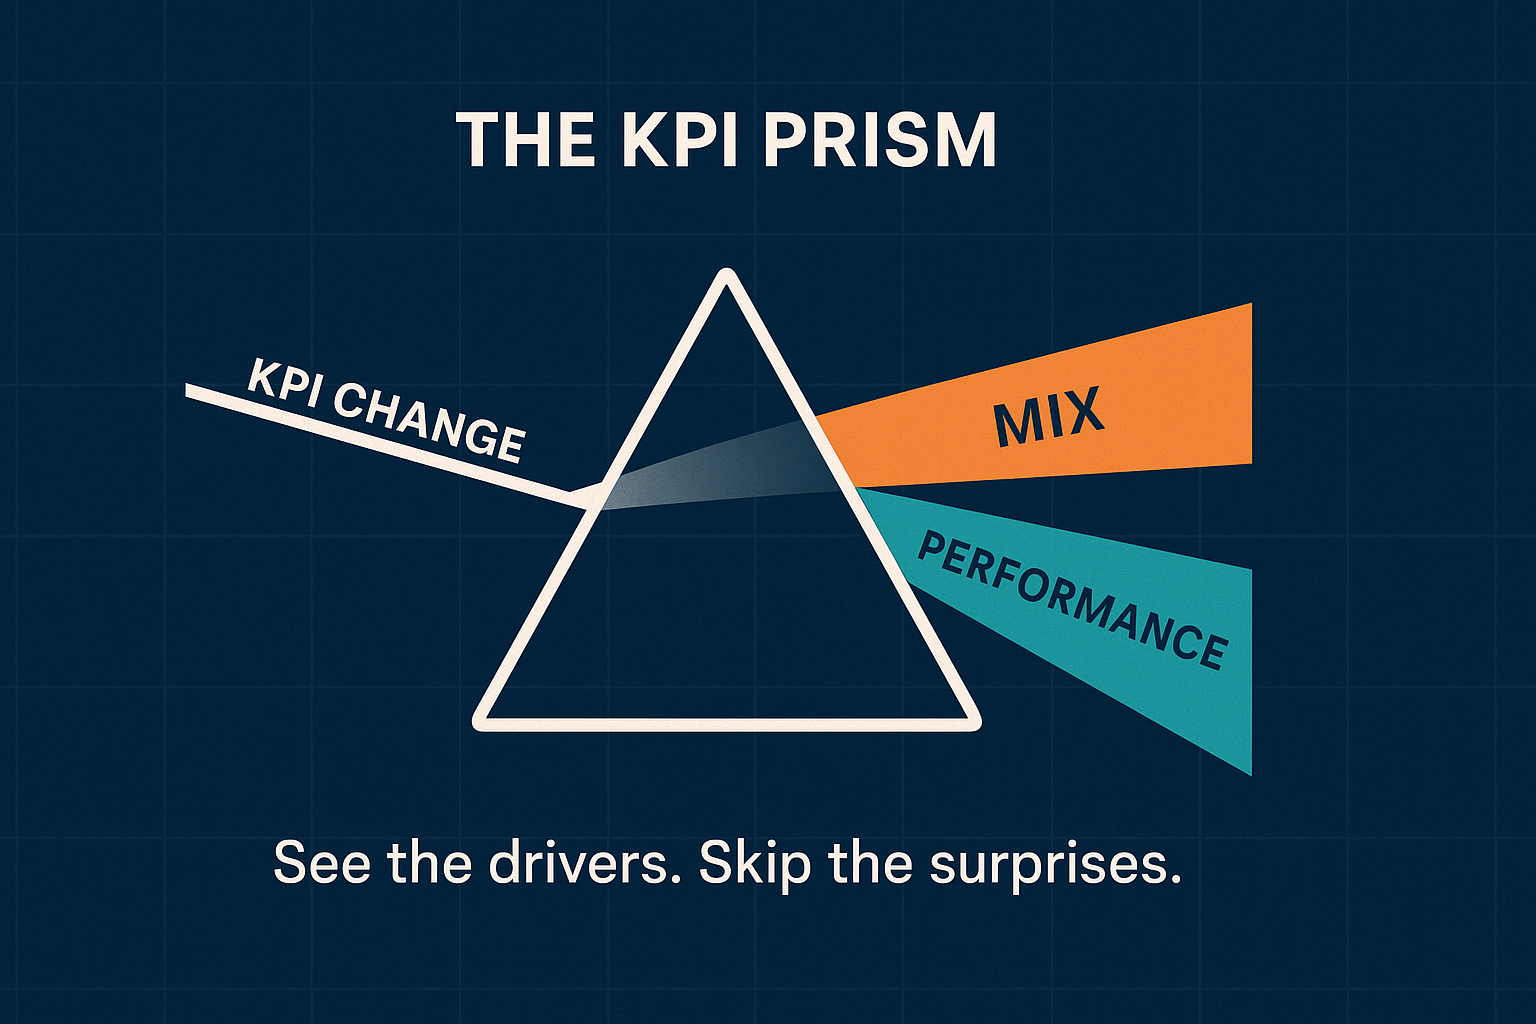
In global SaaS, every KPI is a weighted average of the same metric across many sub-segments. If you don’t separate mix effects from performance changes, it’s easy to celebrate phantom wins or miss real degradation.
Every month, leadership gathers around dashboards of revenue, CAC, churn, and conversion. A line moves and the first question is: What drove the change? Too often, the answer reveals an analytical blind spot: improvements are merely favorable mix shifts; declines reflect changing customer composition, not operational failure. Sometimes that mix shift is even strategic.
This isn’t academic nitpicking. Misreading mix vs. performance leads to misallocated resources, poor strategic calls, and missed optimization, despite good intentions. If you want to make confident, data-driven decisions, you must decompose the change.
The Hidden Complexity Behind Every KPI
Why Simple Metrics Mask Complex Reality
Consider your monthly billing success rate, what I call the Stealthberg KPI. Suppose it drops ~40 bps month-over-month. Instinct says: inspect the processor, recent releases, or fraud rules. But the culprit may be a mix shift: more international customers (lower authorization rates) or a tilt from credit to debit. With a typical ~10-point credit-vs-debit authorization rate gap, a 4-point mix shift toward debit cards can move billing success ~40 bps without any true performance change.
This scenario illustrates the fundamental challenge: every KPI in a global business is actually a weighted average of multiple underlying segments, each with different baseline performance characteristics. When those segments shift in proportion, the “mix” effect, your overall KPI changes even when nothing about actual performance has changed (or has even moved the opposite direction).
The Business Impact of Analytical Confusion
The consequences of conflating mix and performance changes extend far beyond academic precision:
- Resource Misallocation: Teams chase payment infrastructure fixes when the driver is geographic expansion, in line with the company’s growth strategy
- False Confidence: Leaders applaud improvements driven by aging tenure mix, not durable gains activating customers to take the desired action
- Missed Opportunities: Real improvements get masked by unfavorable mix shifts (Foreign Exchange rates can do this, too, whenever a currency-of-record is in use)
- Strategic Misalignment: Business decisions are made based on partial stories, rather than the full performance picture (for retention KPIs, use the Fishbone Framework to help solve this challenge)
The Anatomy of Mix vs. Performance
Defining the Components
Before diving into methodology, it’s essential to understand what we mean by “mix” and “performance”:
- Mix Effect: the change caused by shifts in the composition of segments (customer base, transaction type, region, etc.)
- Performance Change: the change caused by segment performance moving up or down
- Covariance: depending on the KPI, the dimensionality used for segmenting mix, and the scale of mix and performance changes period-over-period, there may be interaction when both mix and performance change at once (e.g., a growing, above-average segment also improves). It can amplify or offset the respective changes.
Identifying the Right Segmentation Dimensions
Not every dimension matters for every KPI. Start with those most predictive for the metric at hand or those that seem evident for your business. Don’t know what to start with? Ask around; you will probably get 3 or 4 common answers. Some of the common dimensions are:
- Geography: Infrastructure, regulation, and behavior vary by region. For example, for billing success rate, expansion into Latin America could lower renewal authorization rates and increase involuntary churn, without operational regression.
- Customer / Product Type: Enterprise customers often behave differently from small business or consumer segments. B2B customers might have higher billing success rates due to commercial credit cards and dedicated accounts payable processes, while consumer segments might show more volatility based on personal financial cycles.
- Payment Method: For payments-related KPIs like the Stealthberg KPI (billing success rate), payment method differences create some of the largest mix effects. As mentioned previously, credit cards typically authorize at rates 8-12 percentage points higher than debit cards due to various factors in the payments ecosystem.
- Tenure: Cohorts “shake out” over time. Older cohorts retain better simply because lower-propensity customers already churned. A couple of years of weak acquisition can raise average renewal rates (older base) and reduce total renewals—and eventually ARR—because there are fewer customers to renew.
- Temporal Dimensions: Seasonality, day-of-week, or other macro cycles. Sometimes “seasonality” is a proxy for a latent customer attribute correlated with acquisition timing that is otherwise unobservable.
A Real-World Example: Decomposing Billing Success Rate Changes
The Scenario
Let’s examine a practical example using billing success rate data from a global SaaS business over two consecutive months:
January Performance:
- Overall billing success rate: 92.0%
- Credit card transactions: 83% of volume at 93.7% success rate
- Debit card transactions: 17% of volume at 83.9% success rate
February Performance:
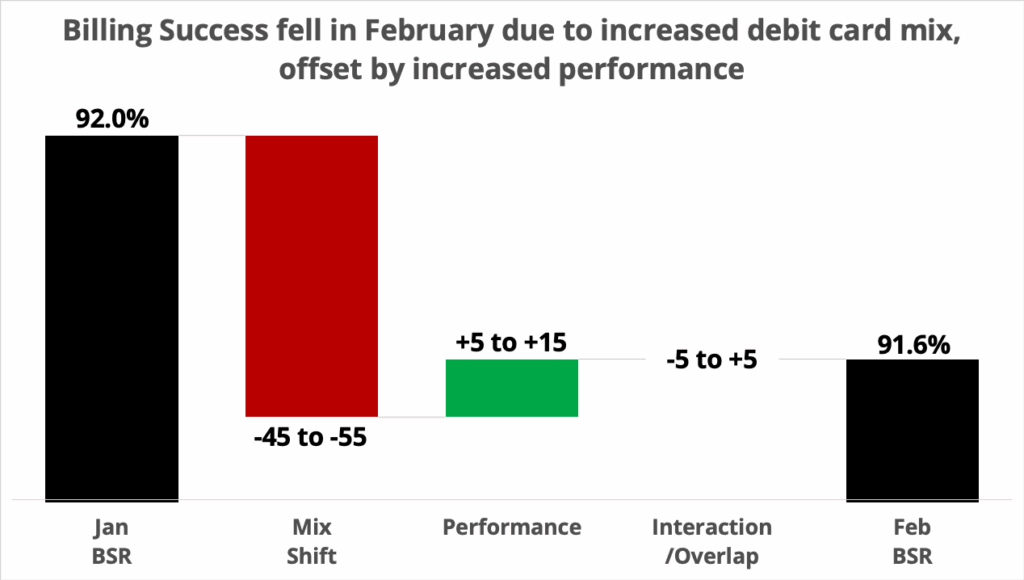
- Overall billing success rate: 91.6% (↓0.4 percentage points, or ~40 bps)
- Credit card transactions: 78% of volume at 93.8% success rate (↑10 bps performance)
- Debit card transactions: 22% of volume at 84.0% success rate (↑10 bps performance)
The Surface-Level Analysis
A simple month-over-month comparison would show declining billing success rate, potentially triggering investigation into payment processor issues, fraud detection changes, or technical problems. The leadership team might panic about revenue impacts and demand immediate operational fixes.
The Mix vs. Performance Reality
However, decomposing this change reveals a completely different story:
- Mix Effect: The shift from 83%/17% to 78%/22% credit/debit composition created a -49 basis point impact on overall billing success rate
- Performance Effect: Actual improvements in both segments (+10 bps credit, +10 bps debit) created a +10 basis point positive impact
- Net Change: -49 bps (mix) + 10 bps (performance) = -39 bps total change
Note: As we only have one dimension to decompose this example, there is no covariance.
The Strategic Insight
Rather than indicating payment infrastructure problems, this analysis reveals that operational performance actually improved across both payment methods. The overall decline resulted entirely from a shift toward debit cards, likely driven by customer acquisition strategies, regional expansion, seasonal patterns, or even customer choice.
This insight completely changes the business response. Instead of investigating payment technical issues, leadership could:
- Understand the payment method mix shift drivers
- Evaluate whether this shift aligns with strategic objectives or requires other changes in other parts of the customer experience
- Consider targeted investments on further debit card authorization rate improvements
- Celebrate the underlying performance improvements that are actually occurring
Effectively Communicate the KPI Change
When communicating the factors like the one highlighted in this example, waterfall charts are amongst the best data storytelling visual available that easily encodes the math into a format accessible for any audience.
Tip: When multiple mix/performance factors move, stack them into one or more waterfall steps to show compounding effects.
Want to dive deeper into the math?
The Mathematical Framework
For teams ready to implement mix vs. performance analysis, here’s the mathematical framework:
Notation:
- KPI₀ = Overall KPI in period 0 (before)
- KPI₁ = Overall KPI in period 1 (after)
- w₀ᵢ = Weight (proportion) of segment i in period 0
- w₁ᵢ = Weight (proportion) of segment i in period 1
- p₀ᵢ = Performance of segment i in period 0
- p₁ᵢ = Performance of segment i in period 1
Overall KPI Calculation: KPI = Σᵢ (wᵢ × pᵢ)
Mix Effect Calculation: Mix Effect = Σᵢ (w₁ᵢ – w₀ᵢ) × p₀ᵢ
Performance Change Calculation:
Performance Change = Σᵢ w₁ᵢ × (p₁ᵢ – p₀ᵢ)
Covariance Calculation: Covariance = Σᵢ (w₁ᵢ – w₀ᵢ) × (p₁ᵢ – p₀ᵢ)
Verification: KPI₁ – KPI₀ = Mix Effect + Performance Change + Covariance
Applications Across SaaS KPIs
The mix vs. performance KPI decomposition methodology applies powerfully to most KPIs in SaaS businesses:
- The Fishbone Framework model of retention, which is a systematic approach for measuring operational factors affecting subscription renewal business performance, lends itself to decomposing the drivers of renewals in a SaaS business.
- Revenue Growth Rate: Changes might reflect shifts in customer acquisition between high-value enterprise deals and smaller SMB accounts rather than actual expansion or contraction within customer segments.
- Customer Acquisition Cost (CAC): Increases could result from targeting new geographic markets with higher acquisition costs rather than declining efficiency in existing channels.
- Conversion Rates: Marketing channel mix, traffic source composition, and lead quality changes all create mix effects that can obscure genuine conversion optimization results.
- The Stealthberg KPI in Detail: Billing success rate exemplifies why mix vs. performance analysis is critical. Consider these common mix factors that affect authorization rates:
- Credit vs. Debit Mix: A 4 percentage point shift toward debit cards typically moves billing success rate by approximately 40 basis points due to the structural ~10 percentage point difference in authorization rates between card types
- Geographic Mix: Expansion into emerging markets can reduce overall authorization rates by 2-5 percentage points even with perfect operational execution
- Customer Tenure Mix: Newer customers often have lower billing success rates due to outdated payment information and less established banking relationships
- Transaction Size Mix: Larger transaction amounts commonly face relatively higher scrutiny from fraud detection systems, creating mix effects if average order value changes
Without decomposing these mix effects, SaaS operators might chase technical optimizations or calculation artifacts when the real opportunity lies in understanding customer acquisition strategy or implementing targeted experiential improvements for specific segments.
Implementation Best Practices
Build the plumbing
- Prioritize Dimensions: Not every dimension matters equally for every KPI. Identify the ones with the largest variance when decomposing the your specific KPIs. Add any additional ones you expect will cause variance as you execute your growth strategy.
- Establish Baseline Reporting: Create dashboards that automatically decompose your critical KPIs into mix and performance components. This prevents the need for ad-hoc analysis every time metrics move unexpectedly.
- Set Materiality Thresholds: Define minimum thresholds for mix effects worth investigating. For example, if geographic shifts create less than 10 basis points of impact, you might choose to focus analytical resources elsewhere, rather than digging in deep into why this mix shift occurred.
- Create Decision Frameworks: Establish clear protocols for how different types of mix vs. performance insights should influence business decisions. Performance improvements might trigger scaling efforts, while unfavorable mix shifts might prompt strategic discussions about customer acquisition.
Communicate for action
- Waterfall Charts: use this visuals first, keeping the math visible and intuitive, like shown above
- Add Narrative Context: always accompany the decomposition with business context about what is driving observed changes. What changes did you make that affected performance changes? Bringing receipts helps spur the necessary conversations and investments.
- Enable Action: present results at the level of organizational control. If your marketing team cannot influence geographic mix but can optimize channel performance, segment results accordingly. At minimum, emphasize what can and cannot be controlled.
- Trend Analysis: Show historical trends of mix & performance so leaders can see whether changes are a signal or just noise.
Advanced Considerations & Common Pitfalls

- Latent dimensions: If residual “performance” swings with patterns, you may be missing a segmentation variable (e.g., device, browser, payment flow). Add it to the mix effect.
- Over-segmentation: Tiny segments create noise. Enforce significance thresholds and remove dimensions where needed.
- Temporal smoothing: Rolling windows or continuous monitoring reduce period boundary artifacts.
- Covariance: Usually small, but during big changes (e.g., rapid geo expansion and other business changes) it can be material—measure it explicitly.
Building Organizational Capability
Cross-Functional Collaboration
Mix vs. performance analysis requires collaboration across traditionally siloed functions:
- Marketing and Growth Teams need to understand how customer acquisition strategy creates mix effects in downstream metrics like retention and billing success.
- Operations Teams focus on performance effects but need visibility into mix changes that might mask or amplify their optimization efforts.
- Finance and Analytics Teams typically own the analytical methodology but require domain expertise from operational teams to interpret results correctly.
- Executive Leadership must understand both mix and performance implications when making strategic decisions about market expansion, customer targeting, and resource allocation.
Training and Change Management
Implementing mix vs. performance analysis often requires shifting organizational mindset from simple metric monitoring to sophisticated analytical thinking. As with most mindset changes, you will be most successful by changing actions and letting the mindset follow. Implement the analytical framework, explain business changes more clearly than ever before, and then watch how the rest of the organization lines up behind this methodology.
Integration with Broader Analytics
Mix vs. performance decomposition works most effectively when integrated with other analytical frameworks:
- Cohort Analysis: Understanding how mix vs. performance effects vary across customer cohorts provides additional insight into long-term business health.
- Attribution Modeling: Marketing attribution becomes more accurate when you can separate performance improvements from favorable audience mix shifts.
- Forecasting Models: Incorporating expected mix changes into forecasting models improves prediction accuracy and scenario planning capability. It also helps with root cause analysis when the actual mix varies from expectation and to prevent panic when known mix changes are ahead.
The goal isn’t analytical perfection. It’s analytical sufficiency to make better business decisions with higher confidence and fewer surprises.
Conclusion: Clarity Through Decomposition
Every number tells a story, but without decomposition, it may be the wrong one. Mix vs. performance analysis turns reactive KPI watching into proactive understanding. You will know whether a dip in billing success demands a payment fix or a strategy review; whether a conversion bump merits budget or a closer look at audience mix; whether churn shifts signal satisfaction issues or shifting cohorts.
The investment is modest compared to the payoff: better decisions, smarter allocation, and fewer surprises. The clarity creates a competitive advantage. Whether you’re optimizing the Stealthberg KPI, applying the Fishbone Framework for retention, or simply trying to understand what’s really happening in your business, the principle holds: separate signal from noise, control from context, and never mistake correlation for causation.
Your KPIs are trying to tell you a story. Make sure you’re listening to the right narrative.
This post is part of a series on subscription business optimization. Start applying this framework to understand your mix vs. performance today!
For more insights on data-driven subscription business optimization, connect with me on LinkedIn.
Leave a Reply to Billing Success Rate—The Stealthberg KPI – David D. Newell Cancel reply